
At Leaning Technologies, we constantly strive to push the boundaries of browser performance, making performance optimization a crucial concern for our developers. Thanks to groundbreaking technologies like CheerpX![]() and CheerpJ
and CheerpJ![]() , we have successfully redefined what was previously considered achievable within the browser’s environment. While working on such advanced projects, we soon encountered the limitations of a traditional profiling approach, like Chrome’s built-in devtools. As a result, we relied on a custom profiling workflow based on internal Chrome tracing for years which was due for an improvement.
, we have successfully redefined what was previously considered achievable within the browser’s environment. While working on such advanced projects, we soon encountered the limitations of a traditional profiling approach, like Chrome’s built-in devtools. As a result, we relied on a custom profiling workflow based on internal Chrome tracing for years which was due for an improvement.
I recently joined Leaning Technologies as an intern, and my primary project was to completely overhaul the existing profiling workflow, making it more streamlined and tailored to our specific needs.
This project was not only an incredible learning experience but also a highly fulfilling and rewarding endeavour. I am excited to share the solutions I developed over the last 6 months and dive into everything I have discovered and learned along the way. The end result is a reliable and intuitive way of profiling web applications in the browser, built upon linux-perf with a combination of custom scripts.
Profiling Web Applications and the limitations with a traditional approach
I only had a vague understanding of profiling at the beginning of my internship, and knew even less about profiling complex applications like the ones we develop at Leaning Technologies. Profiling is an advanced form of dynamic program analysis that measures the performance of a running application. The gathered information serves to assist in program optimization and performance engineering. There are various tools available that can be used to profile an application, such as Google Chrome’s built-in developer tools for web applications, or Linux Performance Events, which we will discuss in more detail later.
Chrome’s developer tools are a well known and widely used tool for profiling applications in the browser. It allows us to record the activity of a website, resulting in a visualised profiling report. The report provides various graphs and timelines that illustrate the CPU’s workload across different tasks. Additionally, it showcases the rendering progress of the website, network request timelines, and more. Probably the most interesting part of the report is the CPU flame chart which is a graphical representation of the stack trace of a program. It helps identify which functions and methods consume the most time and pinpoint areas that require optimization.
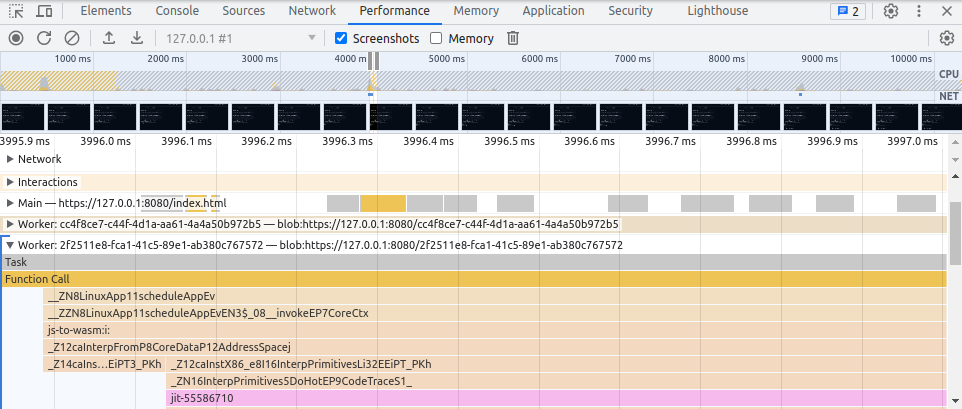
However, this is also where the developer tools reach their limit. When profiling advanced tools like CheerpX in the browser, our goal is to obtain a precise profiling report. Unfortunately, we noticed that the developer tools slightly slow down the compilation time of WebAssembly code. This poses a challenge in identifying the specific areas of a program that require optimization, as the profiling tool itself hampers the execution time.
But not only do the developer tools have a negative impact on execution performance, you also can’t get insight on the native code. While source code information is available for most functions within the developer tools, it does not provide us with any information about the actual native code. In order to understand the underlying issue here we need to dive a little deeper into how CheerpX’s compilation pipeline works and review how the browser manages the compiled code.
CheerpX Compilation Pipeline and missing information in profiling reports
CheerpX is a robust and scalable technology to securely run binary code in the browser. It is written in C++ and compiled to WebAssembly. It lays out the core of WebVM![]() , a server-less Linux virtual environment that runs entirely on the client-side using HTML5/WebAssembly.
, a server-less Linux virtual environment that runs entirely on the client-side using HTML5/WebAssembly.
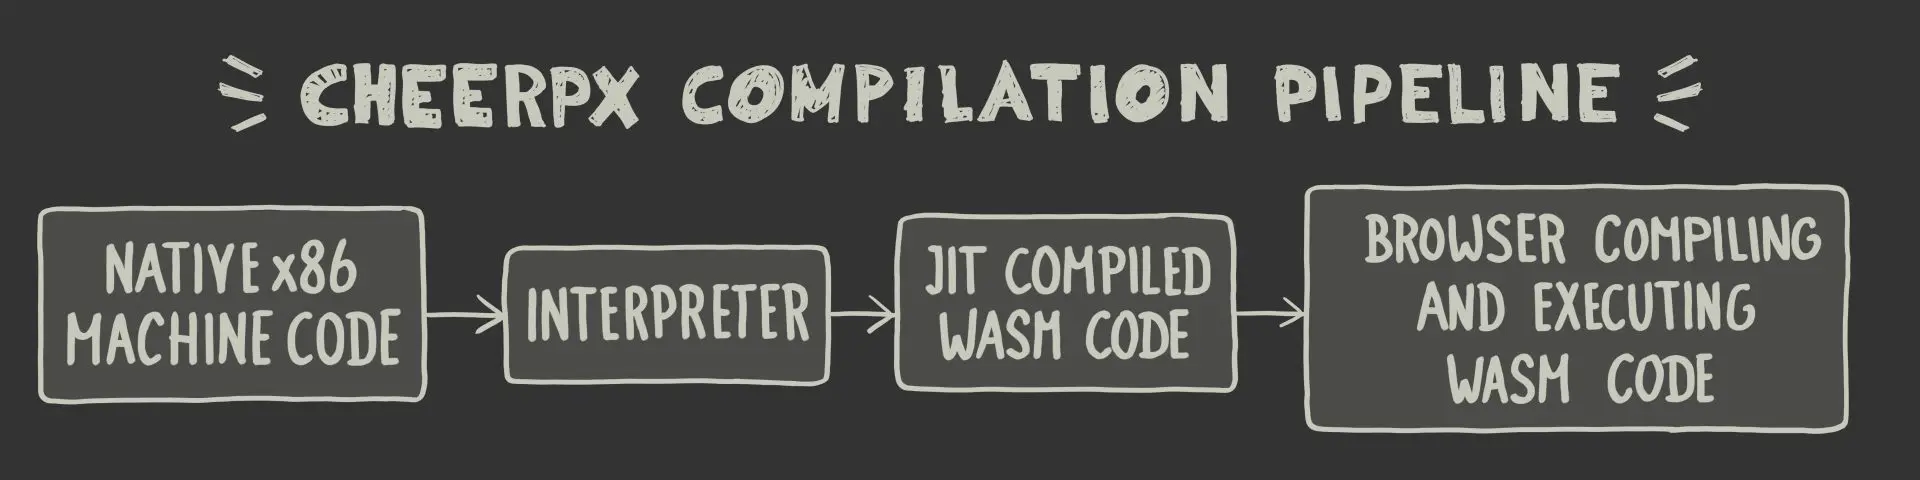
CheerpX adopts a two-tier execution engine, consisting of an interpreter and a JIT compiler. Here’s how it works: The native x86 machine code is first processed by the interpreter, executing one instruction at a time and collecting data for future optimizations. This data helps build a control flow graph, which identifies the hot sections of executed functions. When a code trace in the control flow graph becomes hot, it is compiled to WebAssembly, which is the second part of the execution engine.
The generated WebAssembly code is now validated by the browser’s WebAssembly runtime. Once the code is validated, the browser performs further compilation and turns the WebAssembly code back into machine code which gets executed directly by the browser. This executed native code is also what we observe and analyse in our profiling report. Which brings us back to the underlying issue with a conventional profiling approach using devtools or other profiling programs. We can observe the code executed by the browser, but it does not reflect the original code executed by CheerpX. The information presented in the profiling report is a proxy rather than the actual code itself.
To fix this issue, the goal for our custom profiling workflow is to map the original native X86 code to the native code we see in the profiling report. The first step in making this work was getting more familiar with a different profiling tool, Linux Performance Events.
Linux Performance Events
Linux Performance Events, also known as linux perf, is a powerful profiling and performance analysis tool built into the Linux kernel. It provides us with a wide range of performance monitoring capabilities, allowing us to gather detailed information about various aspects of system performance, such as CPU utilisation, memory usage, disk I/O, and more. Linux perf leverages hardware performance counters and software events to collect data at a low level, enabling in-depth analysis of code execution, identifying performance bottlenecks and optimising system performance. Linux perf can also be used for profiling web applications together with Google Chrome’s JavaScript engine V8, which natively supports linux perf.
One of the initial challenges I faced during my internship was ensuring smooth integration between linux perf and Google Chrome. Linux perf is available pre-installed on most Linux machines since it is included in the linux-tools package. With minimal effort, I was able to generate profiling reports for basic C++ applications. After getting more comfortable with the tool, the next step was to profile an application in the browser. The official V8 documentation has a brief section about profiling with linux perf. However, the majority of useful information can be found on various Google websites, which primarily target Google/V8 developers themselves. Reading through various documentations and identifying a suitable setup for our work environment proved to be more time-consuming than anticipated.
Once everything was set up and working, it was time for the next step, automating the profiling workflow. Currently if you want to profile an application in the browser with linux perf there are various steps involved that can get rather tedious and time consuming. You need to start Chrome from the command line with custom V8 flags to enable profiling, use linux perf to record events on Chrome’s renderer process id and post process the generated reports. I used Python to create a custom script that automates all of these steps, and the end result was an easy to follow workflow.
This custom profiling script resolved our initial issues with Chrome’s DevTools. The V8 flags that enable profiling support do not impact the execution time of our technologies in the browser. The next step of my project was to find a way to observe native code in a profiling report.
Exploring Source Code and Binary Files
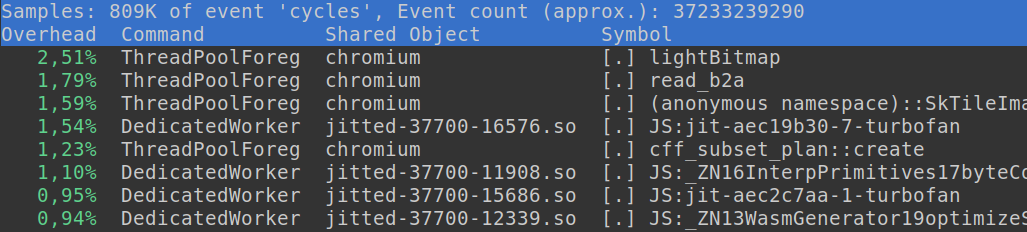
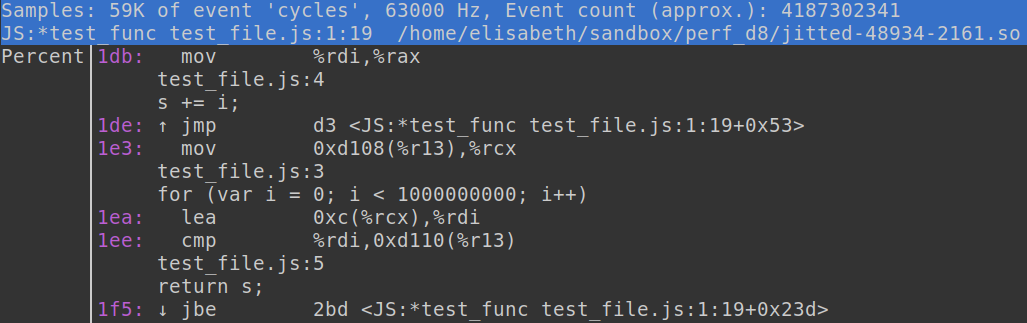
Navigating through a performance report generated by linux perf is a straightforward process. By opening a report from the command line, you are able to examine the data using the integrated TUI (Text User Interface). You can quickly identify functions that have longer execution times, and furthermore, we can annotate hot functions within the interface to display assembly code. If a function has underlying source code information the annotated output not only shows the assembly code, but also the actual source code of the function.
This feature sparked the idea of mapping the original machine code executed by CheerpX to the native code that is running in the browser, similar to how the source code is mapped to functions in the linux perf profiling output. To accomplish this, I needed to gain a deeper understanding of both the source code of Linux perf and our own technology.
The first step to making this custom workflow work was implementing a new internal feature for CheerpX. As described earlier CheerpX is built upon a two tier execution engine, and we needed a way to gather the native X86 machine code right before it gets compiled to WebAssembly. Understanding the state of the machine code was crucial for this step and the end result is a simple preprocessor define that enables printing out all the native code blocks just before they get compiled to WebAssembly.
The next step was adding the native code blocks to the profiling report. For this step I needed to familiarise myself with file formats such as ELF (Executable and Linkable Format), DWARF (Debugging With Attributed Record Formats) and linux perf’s custom binary format for JIT dumps. During the profiling process with linux perf and V8, V8 generates a jitdump binary that contains information about all the jitted functions in a report. Linux perf can process these jitdump files and uses the processed information to generate ELF object files for each jitted function found in the jitdump. The ELF object files hold all the necessary information about a function like its start address, debug information, source code and assembly code. Upon reading into these binary formats, I came to the conclusion that the best way to incorporate our native source code into the perf report was by updating the jitdump file itself and letting linux perf handle the ELF object files.
I now had all the vital information and data I needed to be able to work with and update the jitdump binary file. However while working with the binary files I encountered my next challenge:a bug in the Linux Kernel source code.
Patching the Linux Kernel
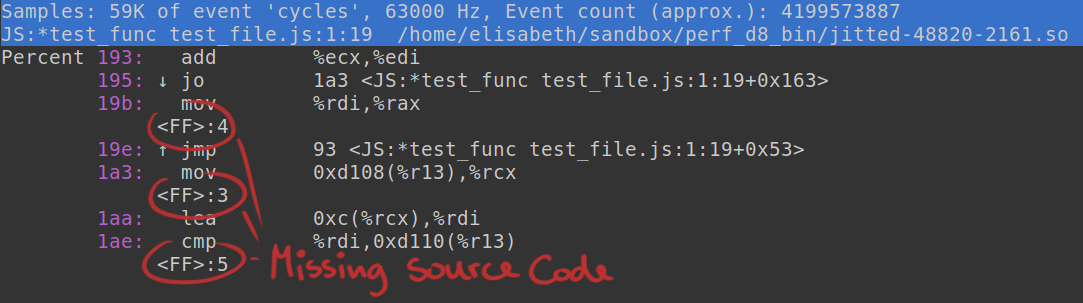
To get better insights into the linux perf source code and develop a deeper understanding of the jitdump format, I began working with a linux kernel source build. During some early test runs I noticed that jitted functions never displayed any source code information in the profiling reports. All I could see was the line number without any additional source code information.
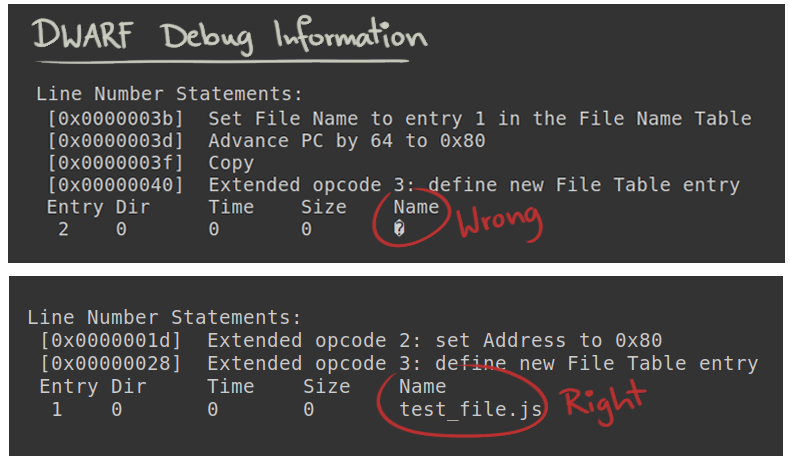
At this stage in the project, I was already familiar with the DWARF debugging file format, which contains all the debug information in an ELF object file. Using tools like ‘objdump’, I was able to get additional information regarding the DWARF data of a jitted function. I was able to confirm that the debug information got inserted into the ELF files, just not correctly.
After modifying the Linux kernel source code, I verified that there was indeed a bug. One of the checks to ensure the correct insertion of a function’s file name into the ELF object was incorrect. I made the necessary code adjustments, cleaned up my changes, and submitted a patch to the Linux Kernel. The patch![]() has been successfully acknowledged and got merged into the linux-next tree, which is the holding area for patches aimed at the next kernel merge window.
has been successfully acknowledged and got merged into the linux-next tree, which is the holding area for patches aimed at the next kernel merge window.
Custom Profiling Workflow
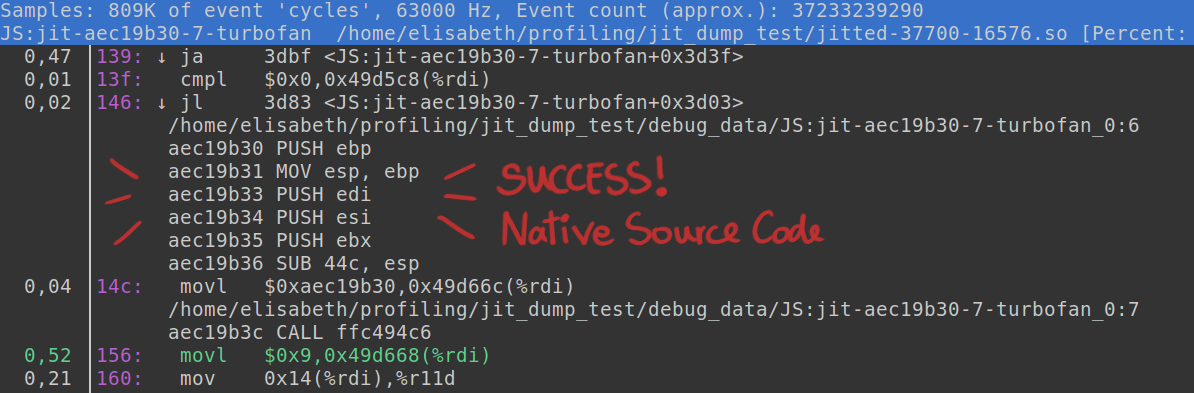
With linux perf working as intended again, I successfully completed our custom profiling workflow for Leaning Technologies. The final outcome is a tailored script that launches chrome and profiles the active tab using linux perf. Additionally, it collects native instructions from CheerpX and incorporates them into the jitdump binary file. When profiling WebVM at Leaning Technologies now, you are going to see native code blocks seamlessly integrated in a perf profiling report.
Try it out yourself
If this post has sparked your curiosity about profiling and exploring Linux perf and Chromium, I have assembled a collection of useful tools and information in a github repository![]() . You will find instructions on building Linux perf from source, basic details about the tool itself, a Linux perf cheat sheet with common commands, and a Linux perf and Chrome cheat sheet with all the commands needed to profile Chrome in one place.
. You will find instructions on building Linux perf from source, basic details about the tool itself, a Linux perf cheat sheet with common commands, and a Linux perf and Chrome cheat sheet with all the commands needed to profile Chrome in one place.
Once you feel comfortable with the tools, you can utilise one of our custom scripts. The script is designed to launch Chromium and record the open tab using Linux perf, offering a user-friendly experience.
Feel free to explore the repository and stay tuned for further updates. For any questions, join us on Discord or get in touch with me on Twitter![]() !
!


